Word embeddings and their Graph Visualizations
Among applications of Natural Language Processing (NLP) in the finance, capturing trending terms from the text data has been hot (trendy!, no fun intended)! However, along with other applications of NLP, it's never easy.
Trending terms
Naïvest thinking of extracting trending terms is to get frequency (or counts) of each term and get the most frequent ones.
However, it's not that simple for various reasons.
First, you don't want to get articles (either definitive or indefinitive) or pretty common words (company for financial news) for trending terms. However, without any diligent preprocessing, that's what you'll get.
Second, even if you do modify to remove common words, what makes a term trendy? How can we define that term?
1) n-grams
Provided that you removed stopwords and punctuations, which are needless for the purpose of analysis, the next step involve utilizing n-grams. In that way, you get frequencies for more grained word compositions (despite with the addition of dull-looking words). While this addition itself does not mean much when we compare the highest frequency terms, it is powerful when we tweak the definition of what trending means.
2) Moving average (MA)
Pretty mundane statiscal tool, moving average comes to rescue here. We don't even have to resort to more advanced Exponential Weighted Moving Average (EWMA). Just classic non-weighted moving average is fine.
The trick is like this.
- Calculate frequency of each word for all timelines.
- Get Moving Average for the frequency of words with the window of your choice.
- Compare the non-MA frequency with MA frequency and check if the former overshoots the latter. i.e., Given recent movements, this specific word is more popular.
Voilà!
Despite sounding pretty mundane, it makes wonder sometimes.
Word embeddings
Now that trending words are identified, how to make it more meaningful? Cest-à-dire, if only 5 to 10 terms are chosen as trending, for instance, how to extend that selection to include related words with them?
Classic solution is to Word2Vec embedding. As with other more recent frameworks, Word2Vec provides a number of (default: 10) related words with each term. While not perfect, in this way, we would get trending terms and related terms (these added terms might not be frequent).
Now let's get down to visualization!
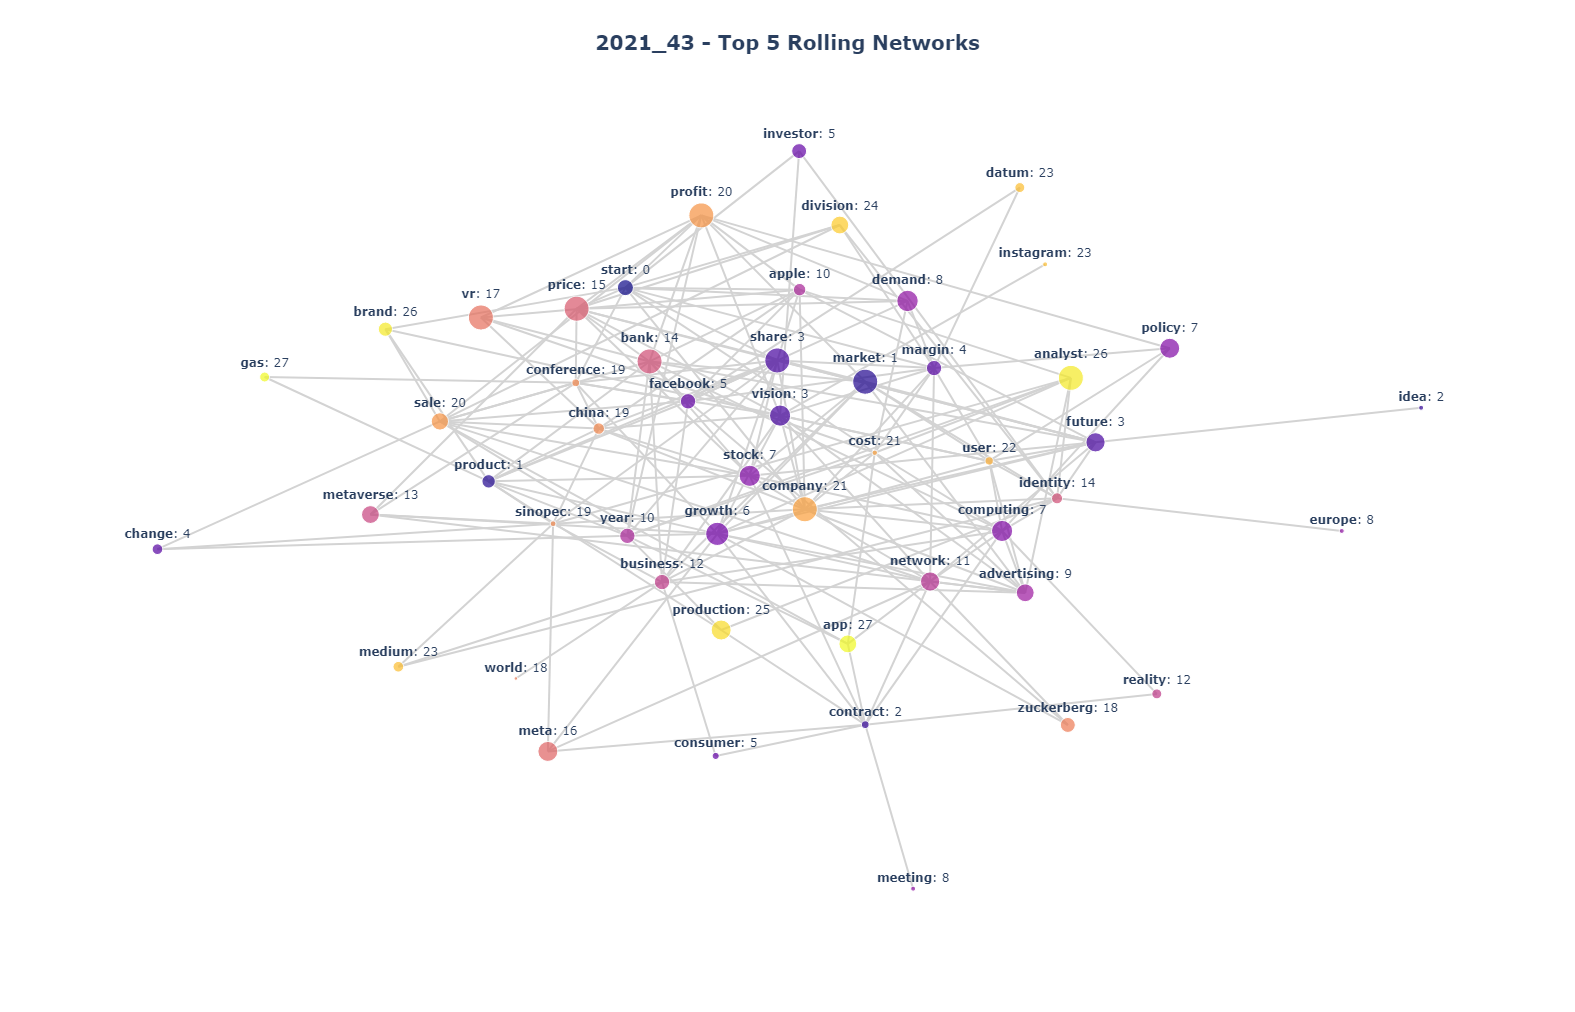
Network Visualization
As the name implies, Word2Vec generates vector of each word. With those vectors in hand, we can graph in 2-D a plane. Unfortunately, these vectors are in much higher dimensions and dimensions reductions are required.Principal Component Analysis (PCA) is widely used for this purpose.
Then, terms can be visualized as a group with node representing each term and edge depicting related terms.
For the clarity, 2-D vectors are used to cluster which group each term would be in. In other words, x, y cooordinates of each word vector are used to perform clustering (K-Means, for example). Each group can be represented by color in the network visualization.
Now, let's see what we did.