visx - A flexible while better integrated with React.js (than D3.js)
D3.js
In the last article, I explored some options of visualizations for Text Analytics in Javascript ecosystem. At the time, I had been trying D3.js for Hierarchical charts (Collapsible Tree and Circle Packing specifically).
D3.js is obviously (one of) the most versatile visualization tool we need. However, as almost any new learners will attest to, the learning curve is very steep and it wasn't invented with React.js or Typescript in mind. Simply put, it is a collection of libraries which can generate a SVG graphic (as well as processing data) in a low-level format.
It gave D3.js a lot of possibilities at the same time frustrated many learners with large lines of codes just to draw a simple SVG and endless ways to achieve a same graphic (i.e., what is the standard way for a simple scatter chart, for instance).
visx
visx (opens in a new tab), previously vx (opens in a new tab), was developed by Airbnb Engineering to solve some of the biggest problems of D3.js. Unlike D3.js, visx targeted both React.js and Typescript.
In this way, React.useRef and/or React.useEffect are not required for every single chart. Also, it's easier to code in a Typescript-friendly way.
While it is still a low-level graphic language (if I may say), component-centric coding definitely pleased React developers.
The fact that it's still low-level language doesn't limit the flexibility of D3.js in terms of graphing varieties.
Why visx
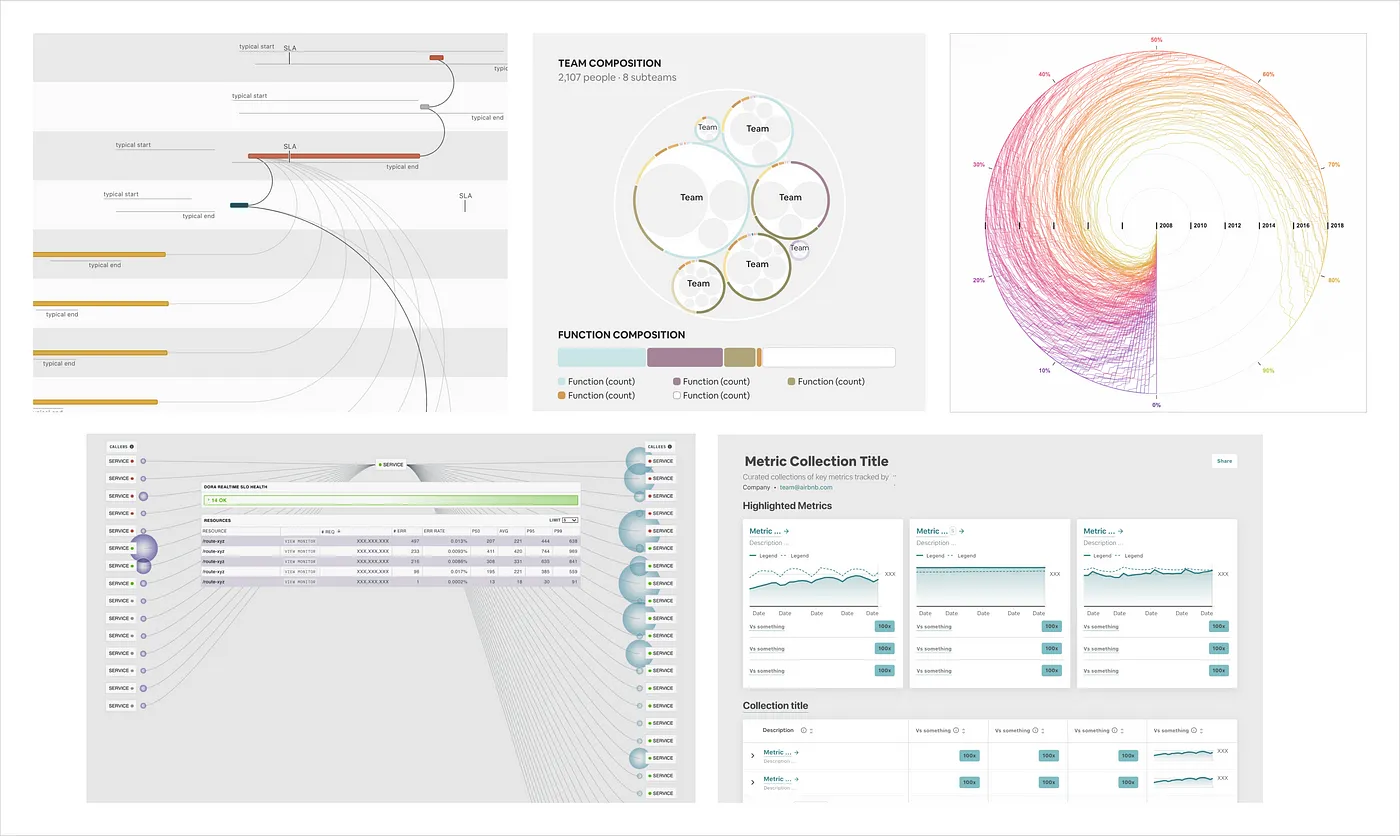
 Source: Airbnb engineering medium (opens in a new tab)
As I mentioned in the beginning, I was exploring rather advanced charts recently (Circle packing, Collapsible Trees).
Altair (opens in a new tab), which I've been using since I first knew Streamlit (opens in a new tab), doesn't offer these charts for instance. Chart.js? NO WAY!
In contrast, visx is one of handful libraries which can handle these charts, thanks to its low-level implementation of D3.js library.
Additionally, I enjoyed using Airflow (opens in a new tab), another great product initially developed by Airbnb. Therefore, as soon as I saw who was behind this library, I was already half into visx.
Using visx
If you're a React developer (not Next.js), there's no roadblock in using visx.
Installation
Like Chart.js, visx is tree-shakeable (i.e., import only necessary sub-modules), and the official documentation mentions separate sub-modules in its examples.
That being said, you can install standalone all-in-one library and import in that way. @visx/visx is that encompassing library. While you might use pnpm to install the library, it is less straightforward than npm (You need to manually install @react-spring/web).
npm @visx/visxNote to Next.js developer
Unlike React.js, using visx within Next.js framework is not straightword with the introduction of version 3.0.
If you follow any of the examples in the documentation in Next.js, it would not work.
Error: require() of ES Module ~/app/node_modules/d3-scale/src/index.js from
~/app/node_modules/@visx/scale/lib/scales/band.js not supported.
Instead change the require of index.js in ~/app/node_modules/@visx/scale/lib/scales/band.js
to a dynamic import() which is available in all CommonJS modules.
The team already knew the problem but solving it would not be easy. Some solutions were proposed on their GitHub repo. Among them, two worked for me.
- Install version 2.18.0 (the last working version with Next.js)
- Use dynamic import with next/dynamic with SSR disabled
Instead of
import MyLineChart from './MyLineChart';Try this
import dynamic from 'next/dynamic';
const MyLineChart = dynamic(() => import('./MyLineChart'), { ssr: false });
For most situations, both worked for me. However, using next/dynamic didn't work inside a MDX file. For this undesirable inconvenience, the first option is the one I chose.