Embedding Datawrapper Chart #1 (feat. Streamlit)
Last year, I introduced my fascination of Datawrapper (opens in a new tab) in the article. For free, Datawrapper provides various forms of beautifully articulated interactive charts, for me, which no visualization library in Python can beat. It even offers API-based creation of charts.
At the time, I was looking for a way to use the charts in Streamlit (opens in a new tab) natively just like using other visualization libraries in Python (such as Altair (opens in a new tab)).
I wasn't intrigued with the API at the time, as most API services impose API usages and I wasn't sure how many API calls I would make (mistakes are inevitable).
Recently, while I was looking for a different form of visualization at Datawrapper other than my favorite heatmap, I found out that the solution was pretty straightforward. Only difference to other Python libraries is that you should embed the visualization in the page or PNG graphics.
Fortunately, Streamlit provides two ways of embeding a html or iframe in the page. Namely, components.html() and components.iframe().
Components.html()
import streamlit as st
import st.components.v1 as components

components.html('<script> <div>some html tags</div> </script>',height=some height,scrolling=True)
As shown above, when using components.html(), full html tags are needed rather than just a web page link. Also, as this is to embed the visualization inside the Streamlit page, desired height should be set by height parameter. Otherwise, only 150px amount of page will be shown. Additionally, scollbar can be added with scrolling option (default: False).
*Caution: Even if the html tag contains the height specification, Components.html() does not respect it. You should explicitly set it with height parameter value.
Components.iframe()
import streamlit as st
import st.components.v1 as components

components.iframe('https://somewebsite.com',height=some height,scrolling=True)
Unlike Components.html(), this does not require the full html tags, rather just the page URL. As before, and obviously, you should set the height option explicitly. Other than specifying the page URL, other options are the same.
OK, How to get the link?
With the previous explanation, you might agree that you would use Components.iframe(), which I use.
In that case, from the following image, you copy the link under Link to your visualiztion with Visualization only radio button selected.
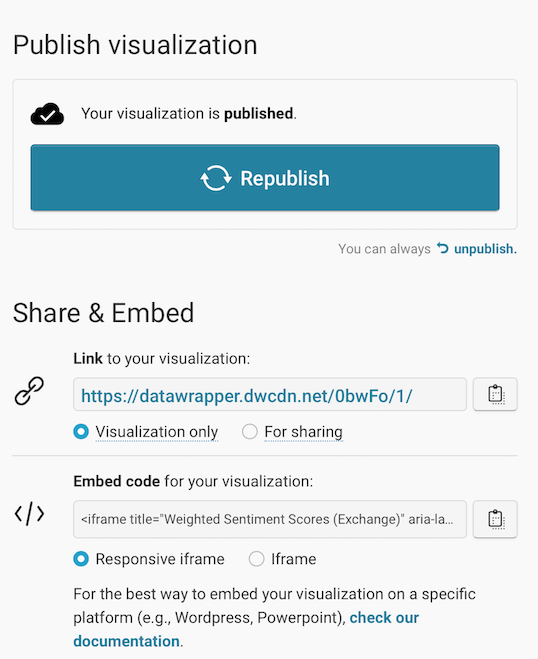
Be sure to republish after you modify your visualization if you want to keep it updated in your webpage or Streamlit application. Otherwise, the embed page points to the previously version of visualization.