Financial News Analysis Dashboard
July 31, 2026Project
Overview
As laid out in the previous post, analyzing financial news incluing Sentiment Analysis and Topic Clustering along with integration between tickers and clusters have been my primary focus.
On top of that, I've always believed a proper visualization is essential to show the analyzed information. Especially, with the Topic Clustering, Hierachical Circle Packing with visx was tried earlier (related post).
In this project, other than added analysis features, integrating the available features and visualizations tightly, making each visualization tab not isolated and fragmented, was equally important.
Pipeline features
Topic Clustering
As briefly mentioned above, Topic Clustering has been a core focus of the pieplines.
While the core concept similar to BERTopic stays same, i.e., UMAP and HDBSCAN, several enhancements were made.
- Vector DB (LanceDB)-powered embedding with mlx-embedding
- Cluster merging
- LLM-generated Topic labels and descriptions
- Linking stock tickers and their topic membership summary
Sentiment Analysis
To enhance the Sentiment Analysis of multiple entities in a financial text, as outlined in the sentiment-finetune, a fine-tuned Sentiment Analysis model based on Gemma 3 was used. While not being the original intention, thanks to LLM's text understanding capabilities, the model was also used to better filter out unnecessary (generic statement) texts.
As the pipeline couples tickers within relevant topics, sentiments are not only calculated in each entity, but also within a topic-level aggregation.
Upcoming IPOs
To better keep track of upcoming market activities, powered by LLMs, the pipeline scans the text and capture candidate IPO companies. To verify the actual market debuts, once pending tickers are confirmed, they are being checked against Yahoo Finance's calendars before being added.
Company Profile
Now, housed in a dedicated Tickers tab, each company has its Profile and Market Positioning, both are being generated with LLMs based on the financial news and SEC 10-K filings.
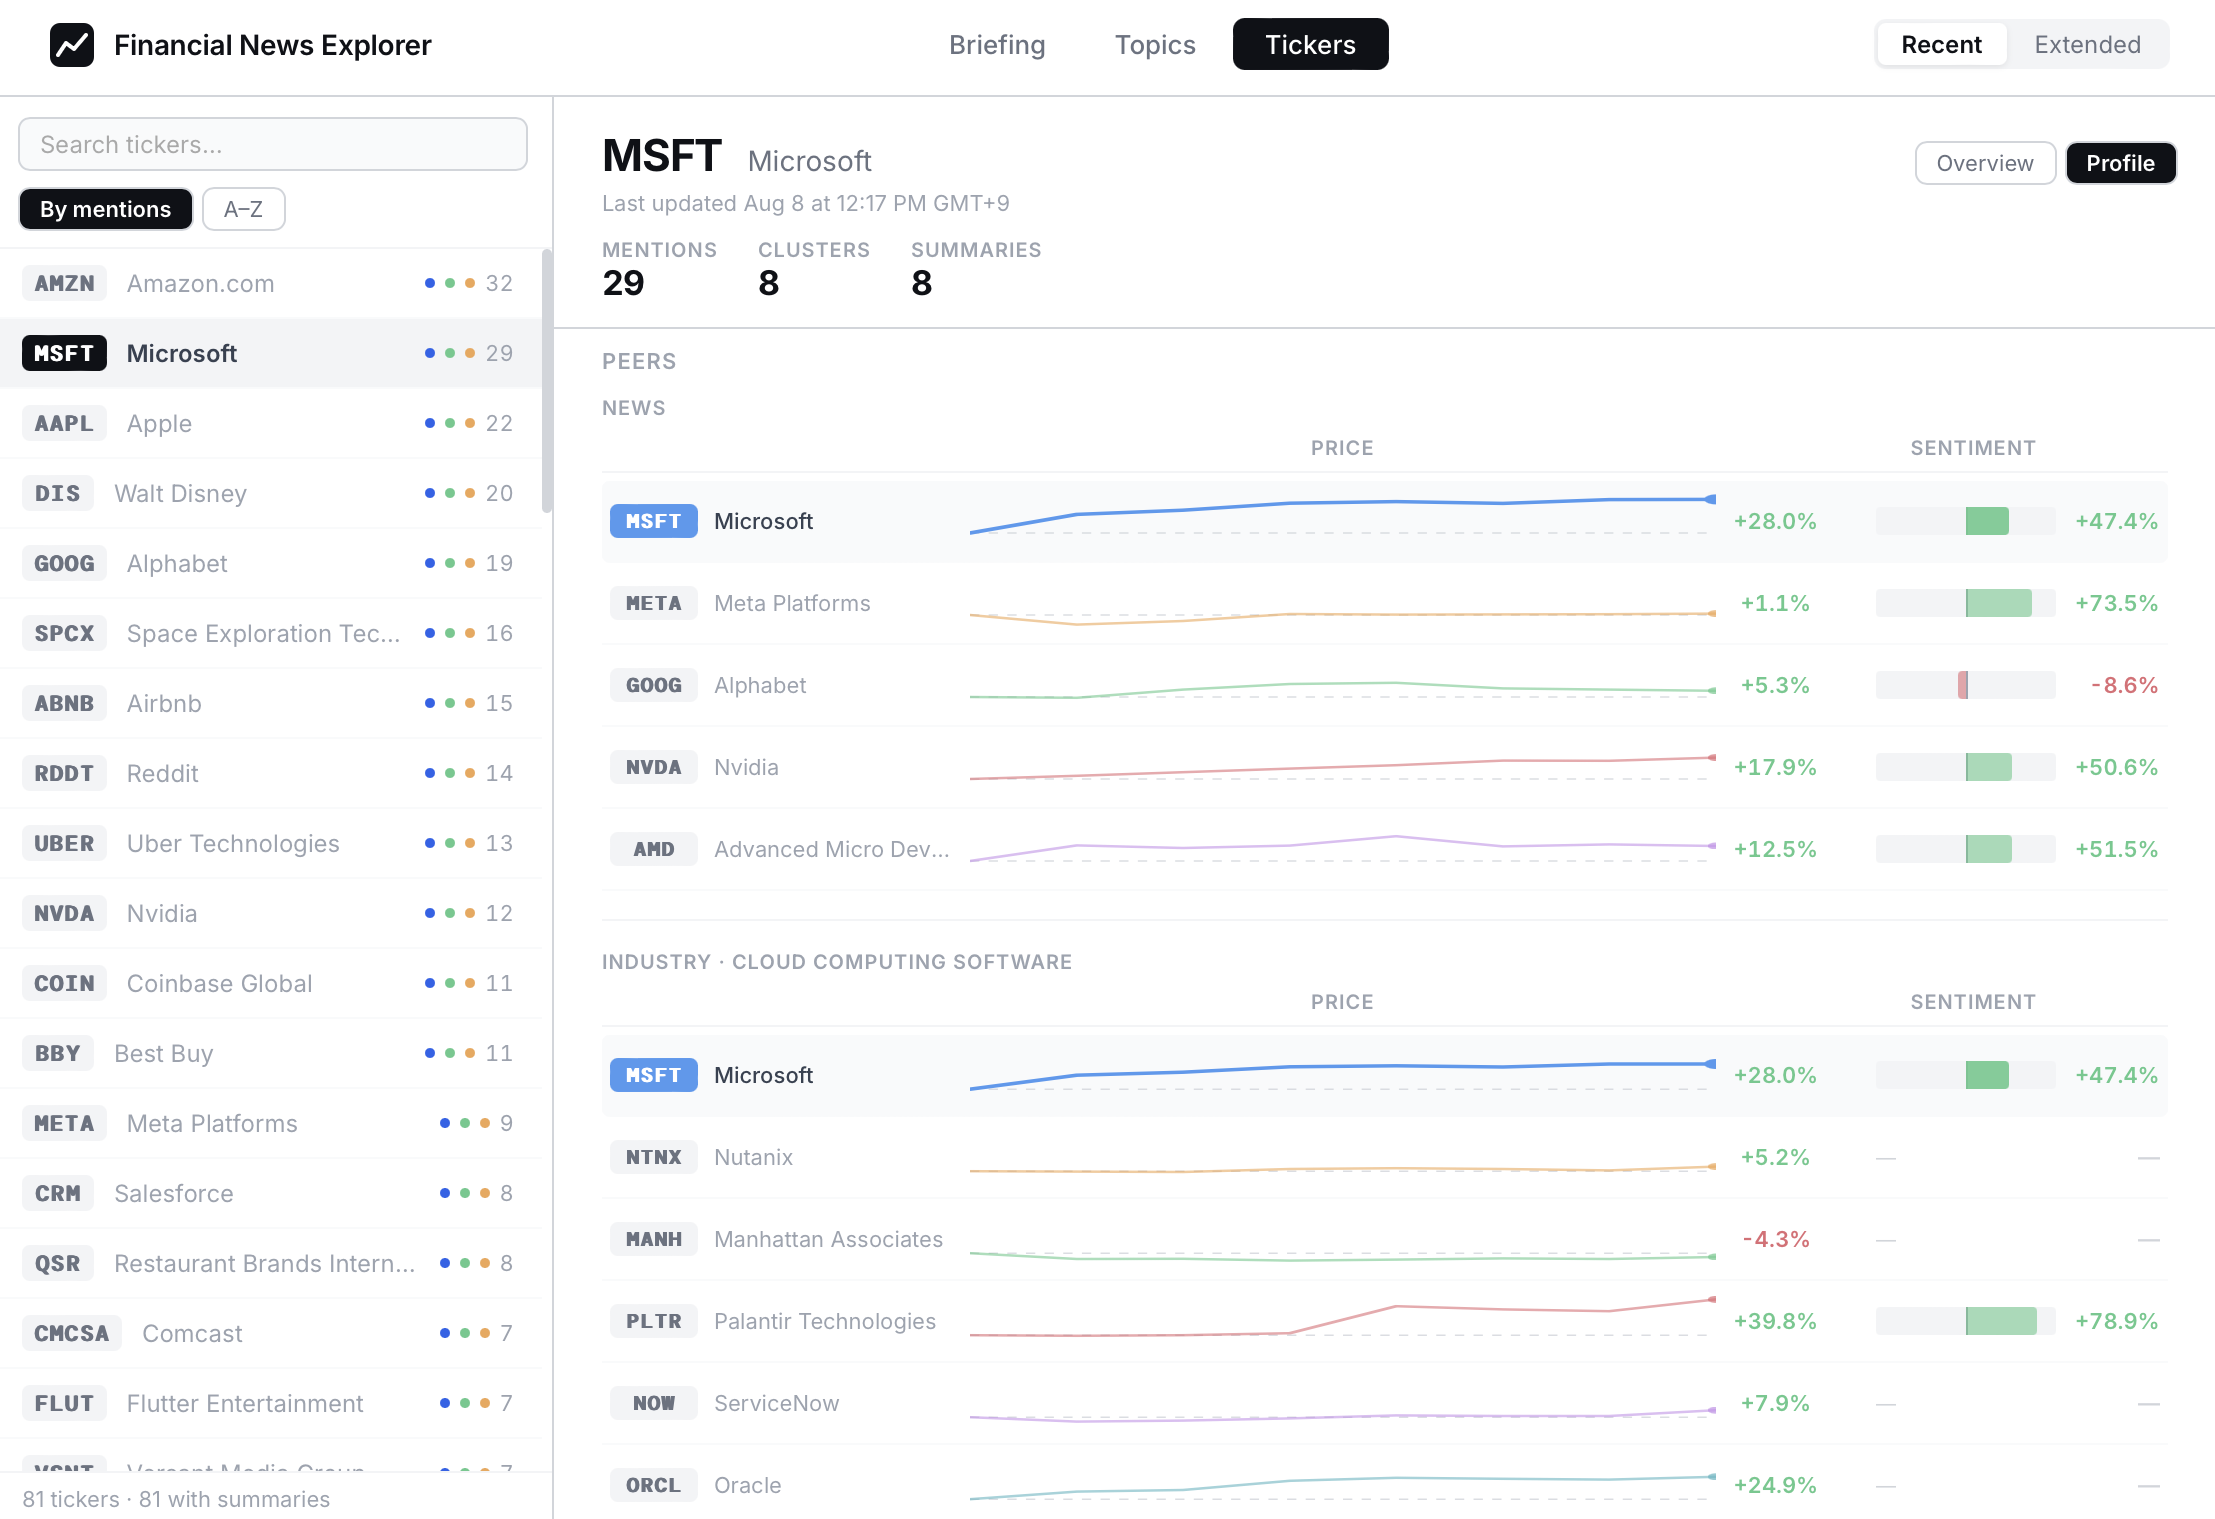
Additionally, companies are being compared against its peers in terms of news (LLM-generated) and industry where they belong to.
Market Briefings
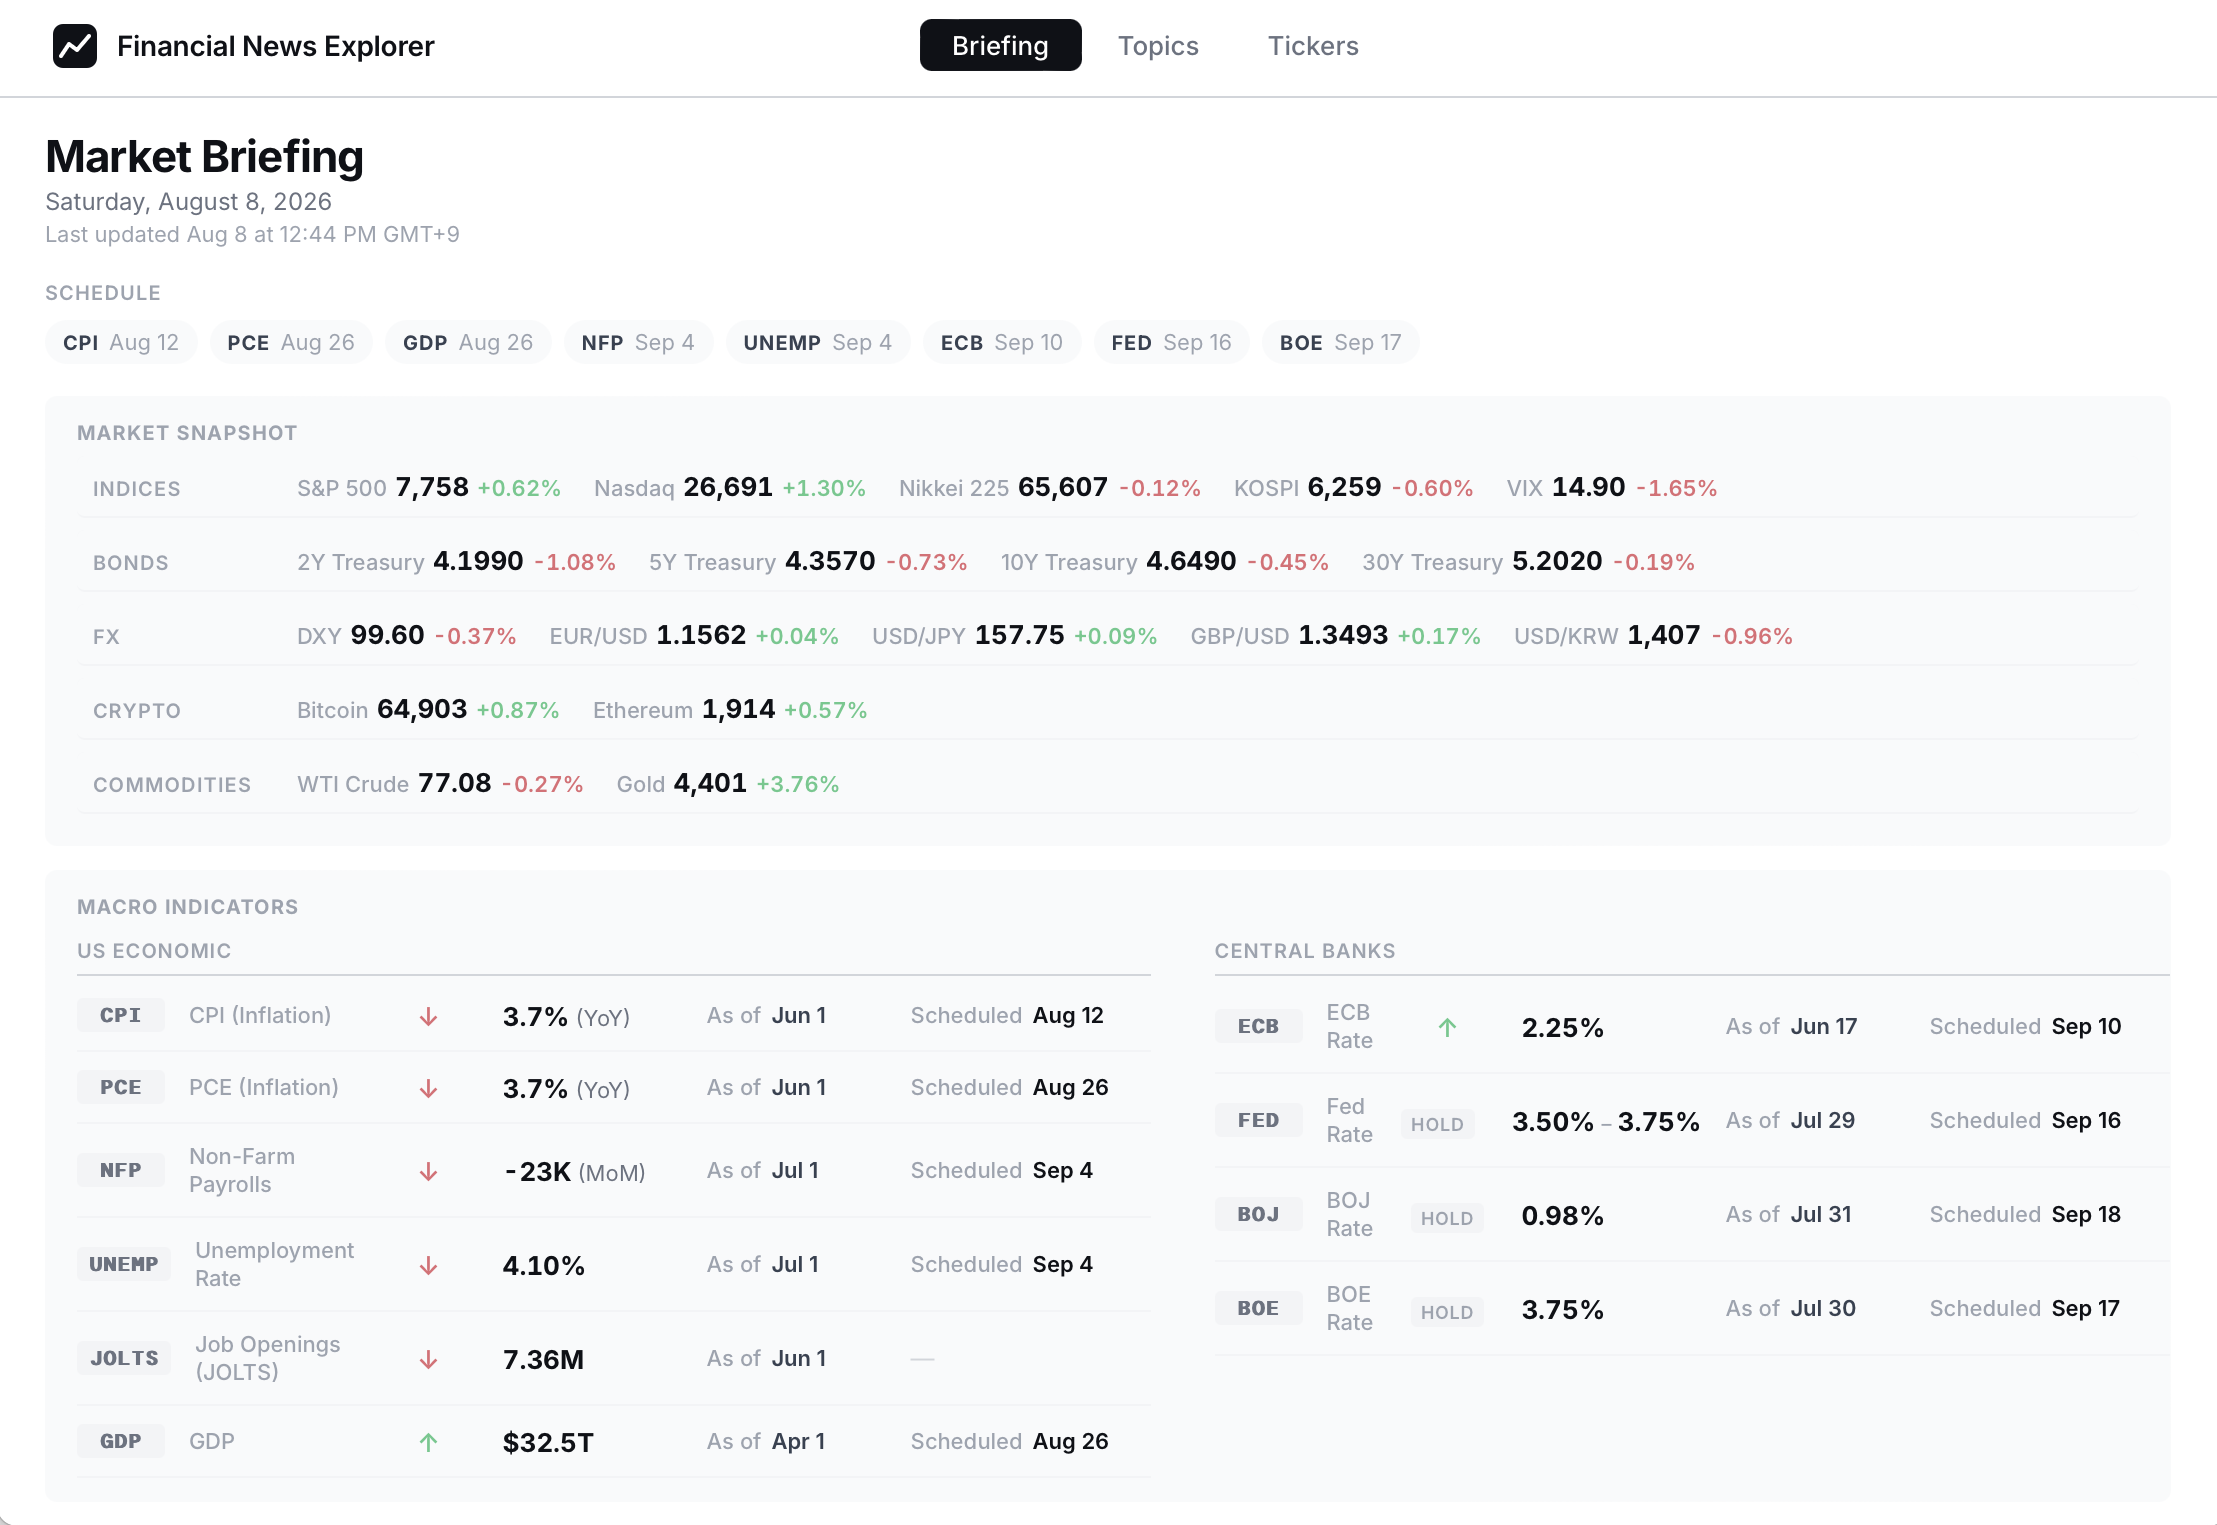
For an daily overview, upcoming schedules, market and economic snapshots, and tickers worth taking a look are presented.
- Upcoming schedules: Economic releases (FRED and Central Banks' decisions) and market debuts are highlighted
- Market snapshots: Financial market figures (Market indices, US Treasury yields, FX, Crypto, and Commodities)
- Market indices: US (S&P 500, NASDAQ, VIX), Asia (Nikkei, KOSPI)
- US Treasury yields: 2-yr, 5-yr, 10-yr, and 30-yr Treasury Yields
- FX markets: US Dollar Index, EUR/USD, USD/JPY, GBP/USD, and USD/KRW
- Crypto markets: BTC and ETH
- Commodities: Gold and WTI Crude Oil
- Economic snapshots: US economic indicators and Central bank rates are summarized
- US Economic Indicators: Inflation (CPI and PCE), Employment (Payrolls, Job Openings and Unemployment Rates) and GDP
- Central Bank rates: FED, ECB, BOE, and BOJ
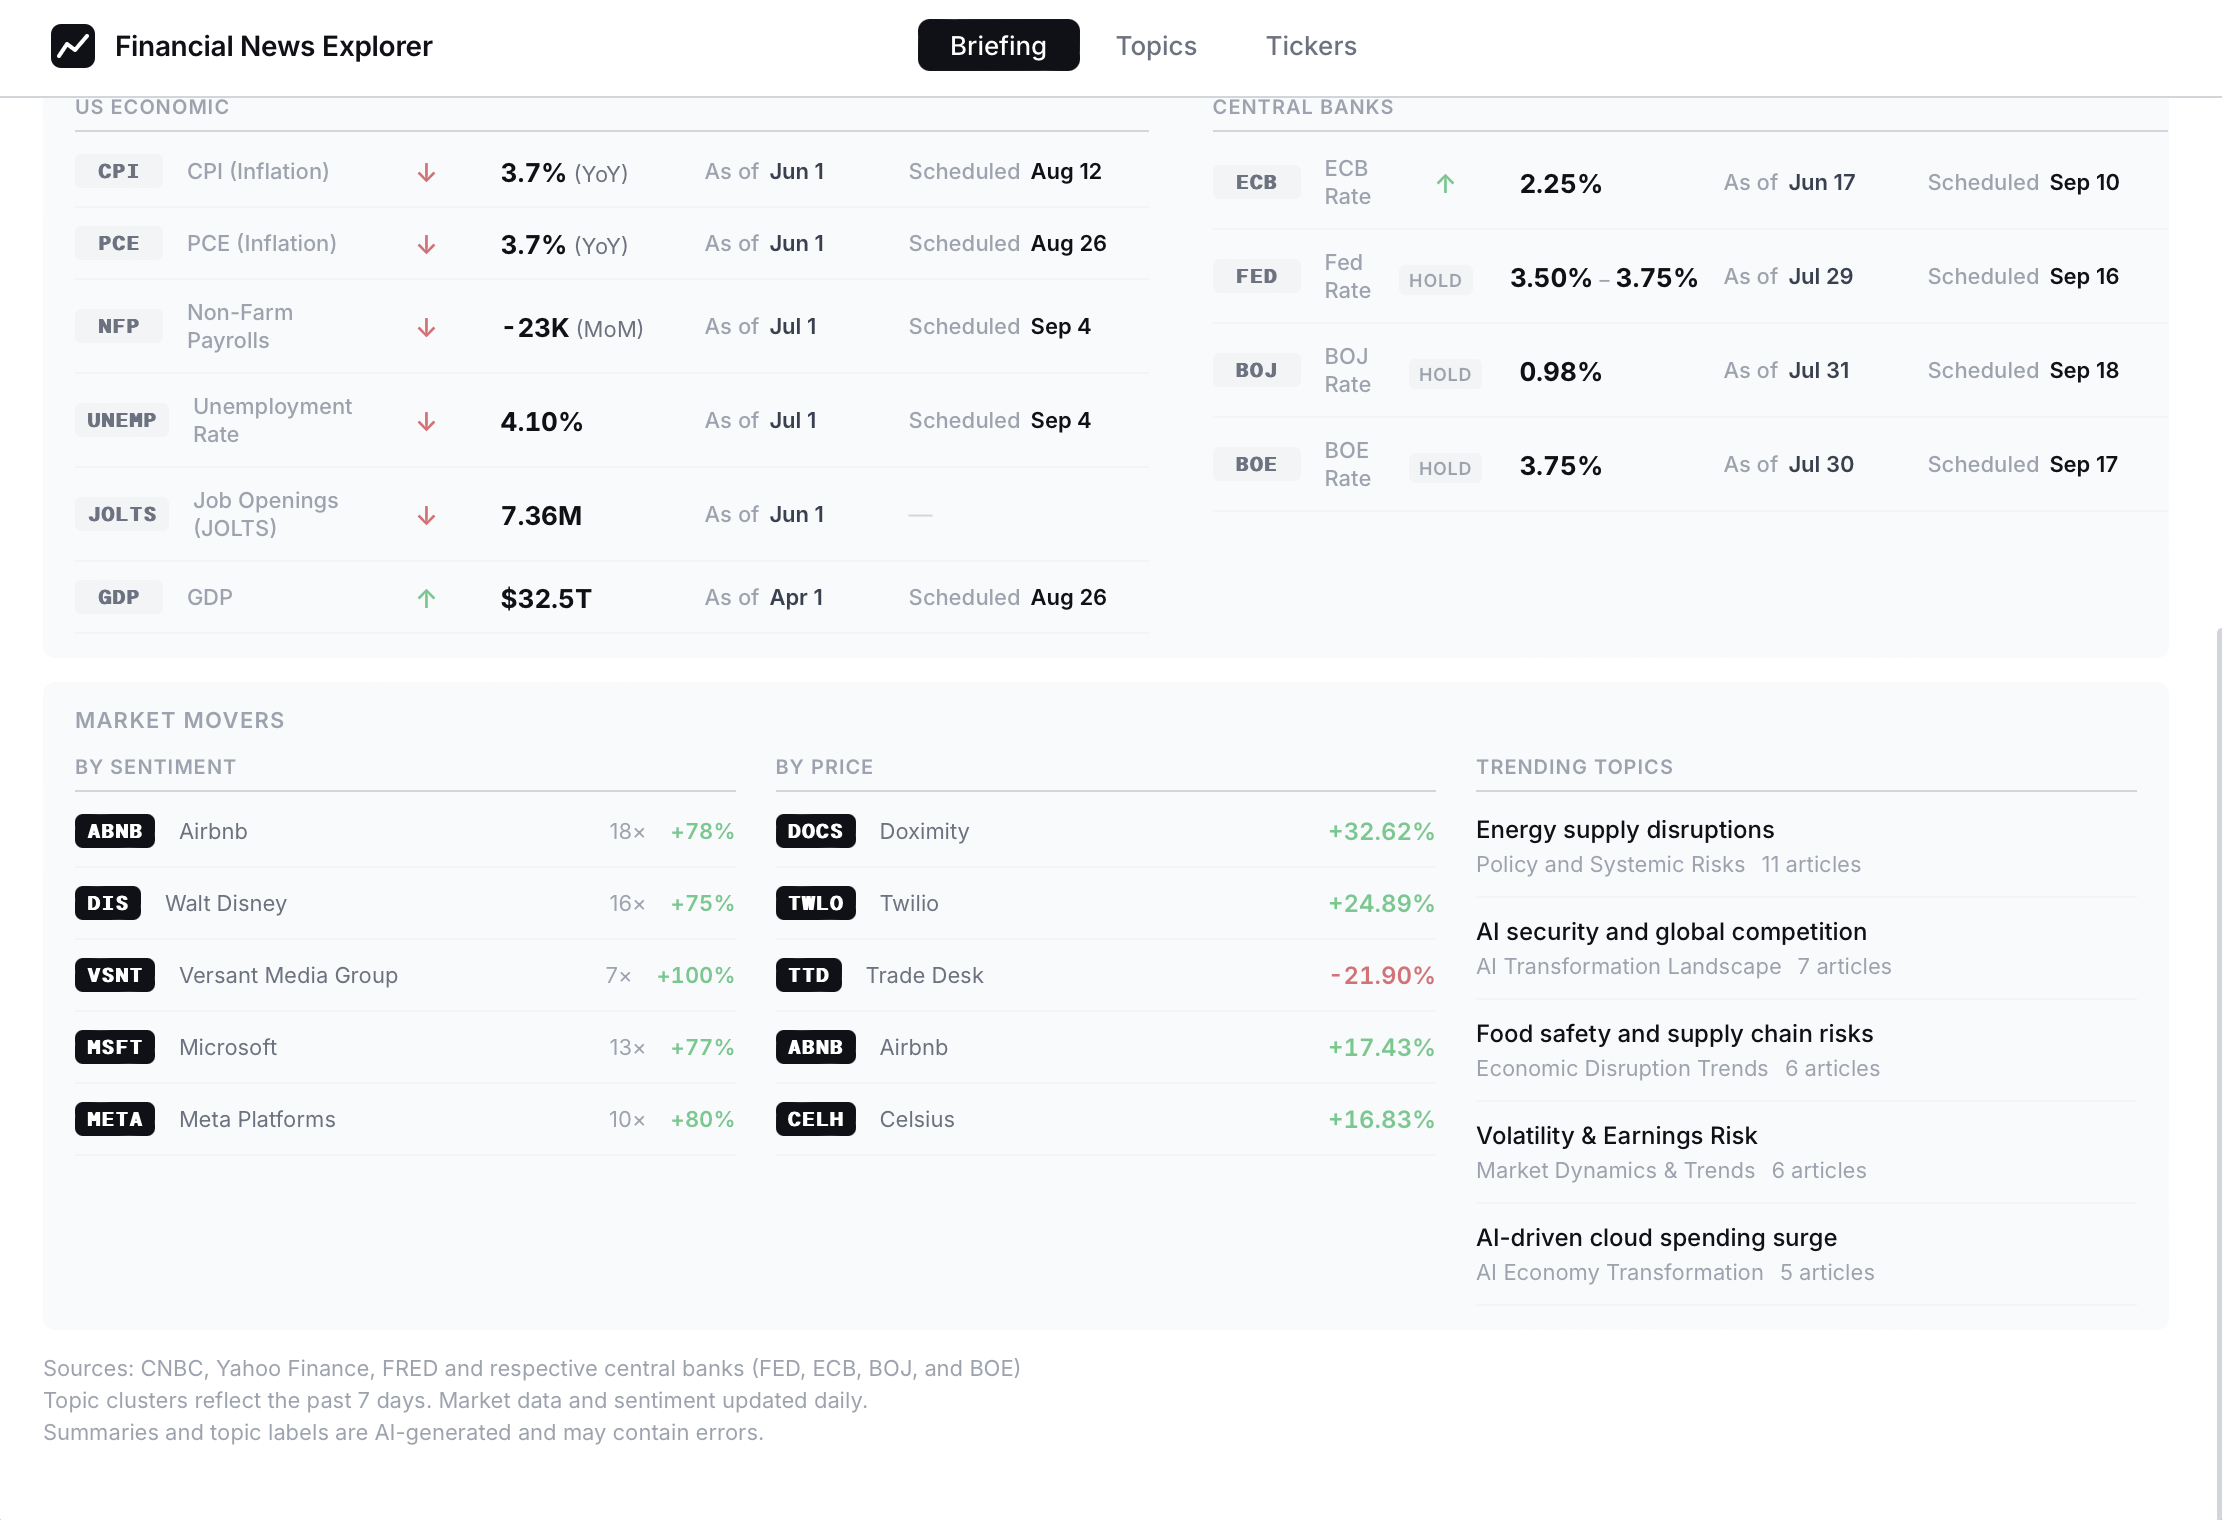
- Market movers: Tickers worth taking a look in terms of Sentiment and Price movements as well as trending Topics are shown
Frontend compositions
The Vite (React)-based frontend has the following linked tabs.
Briefings
Brief daily overview of market and economic summaries are presented.
Topics
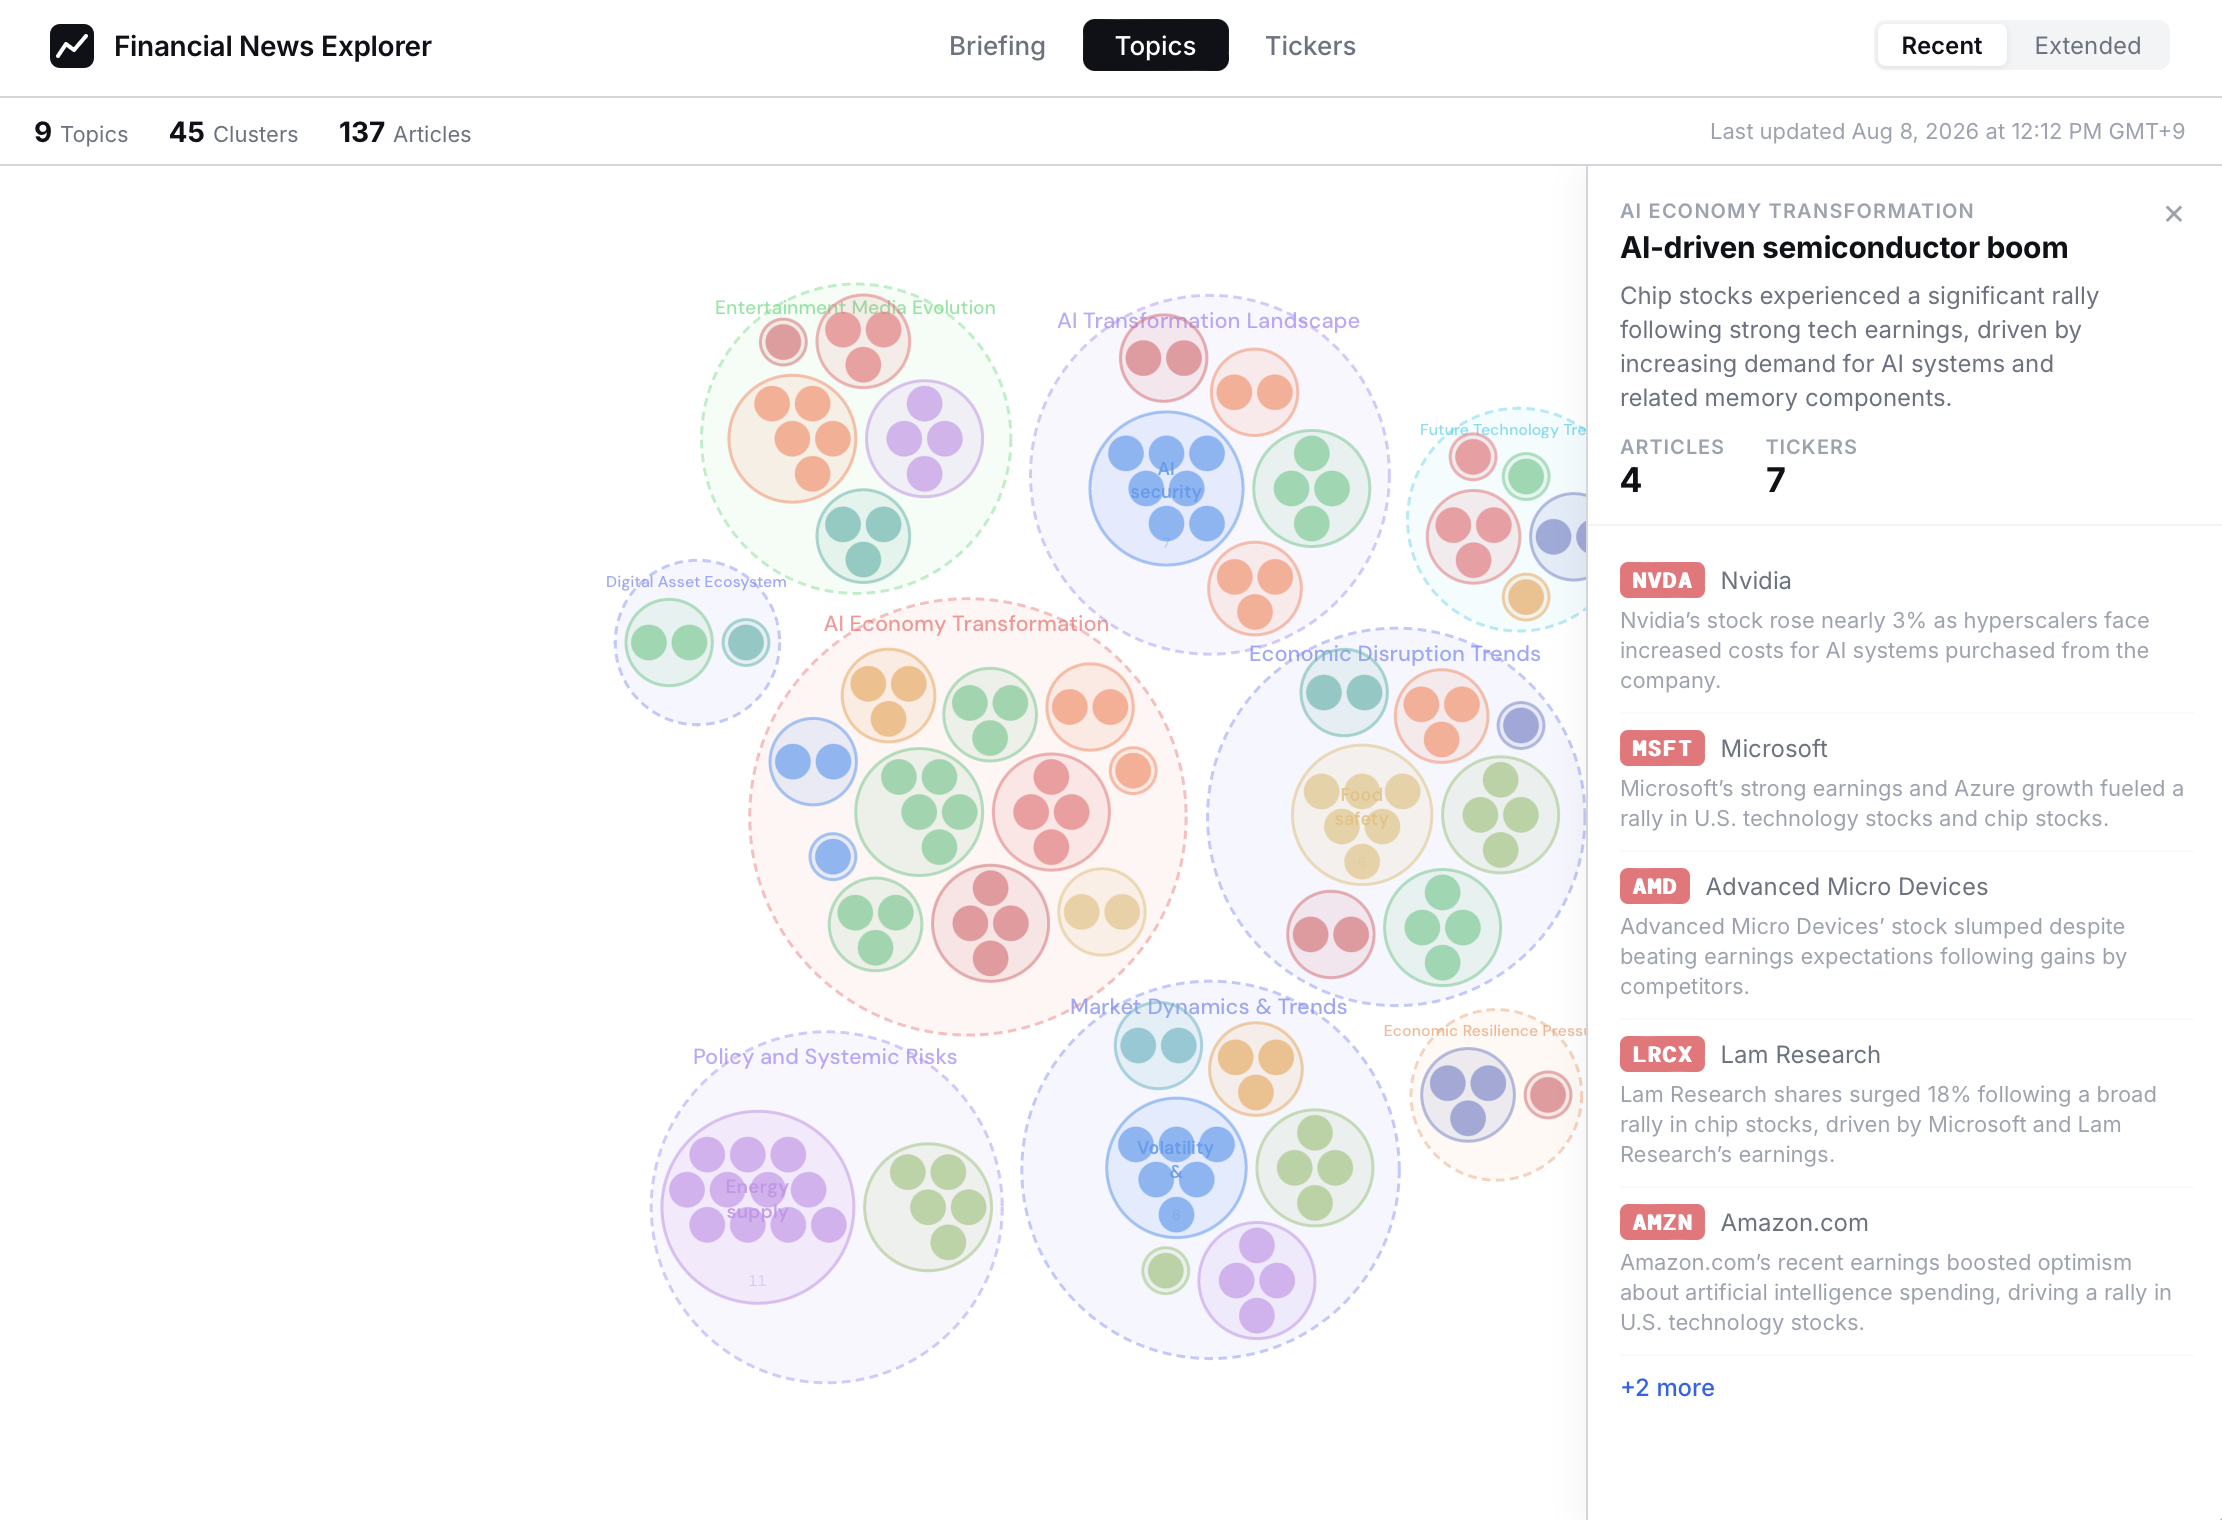
Custom Hierarchical Circle Packing of Topic Clusters are presented where belonging tickers and topic details are shown.
Tickers
Each ticker's details are presented in two dedicated sub-sections.
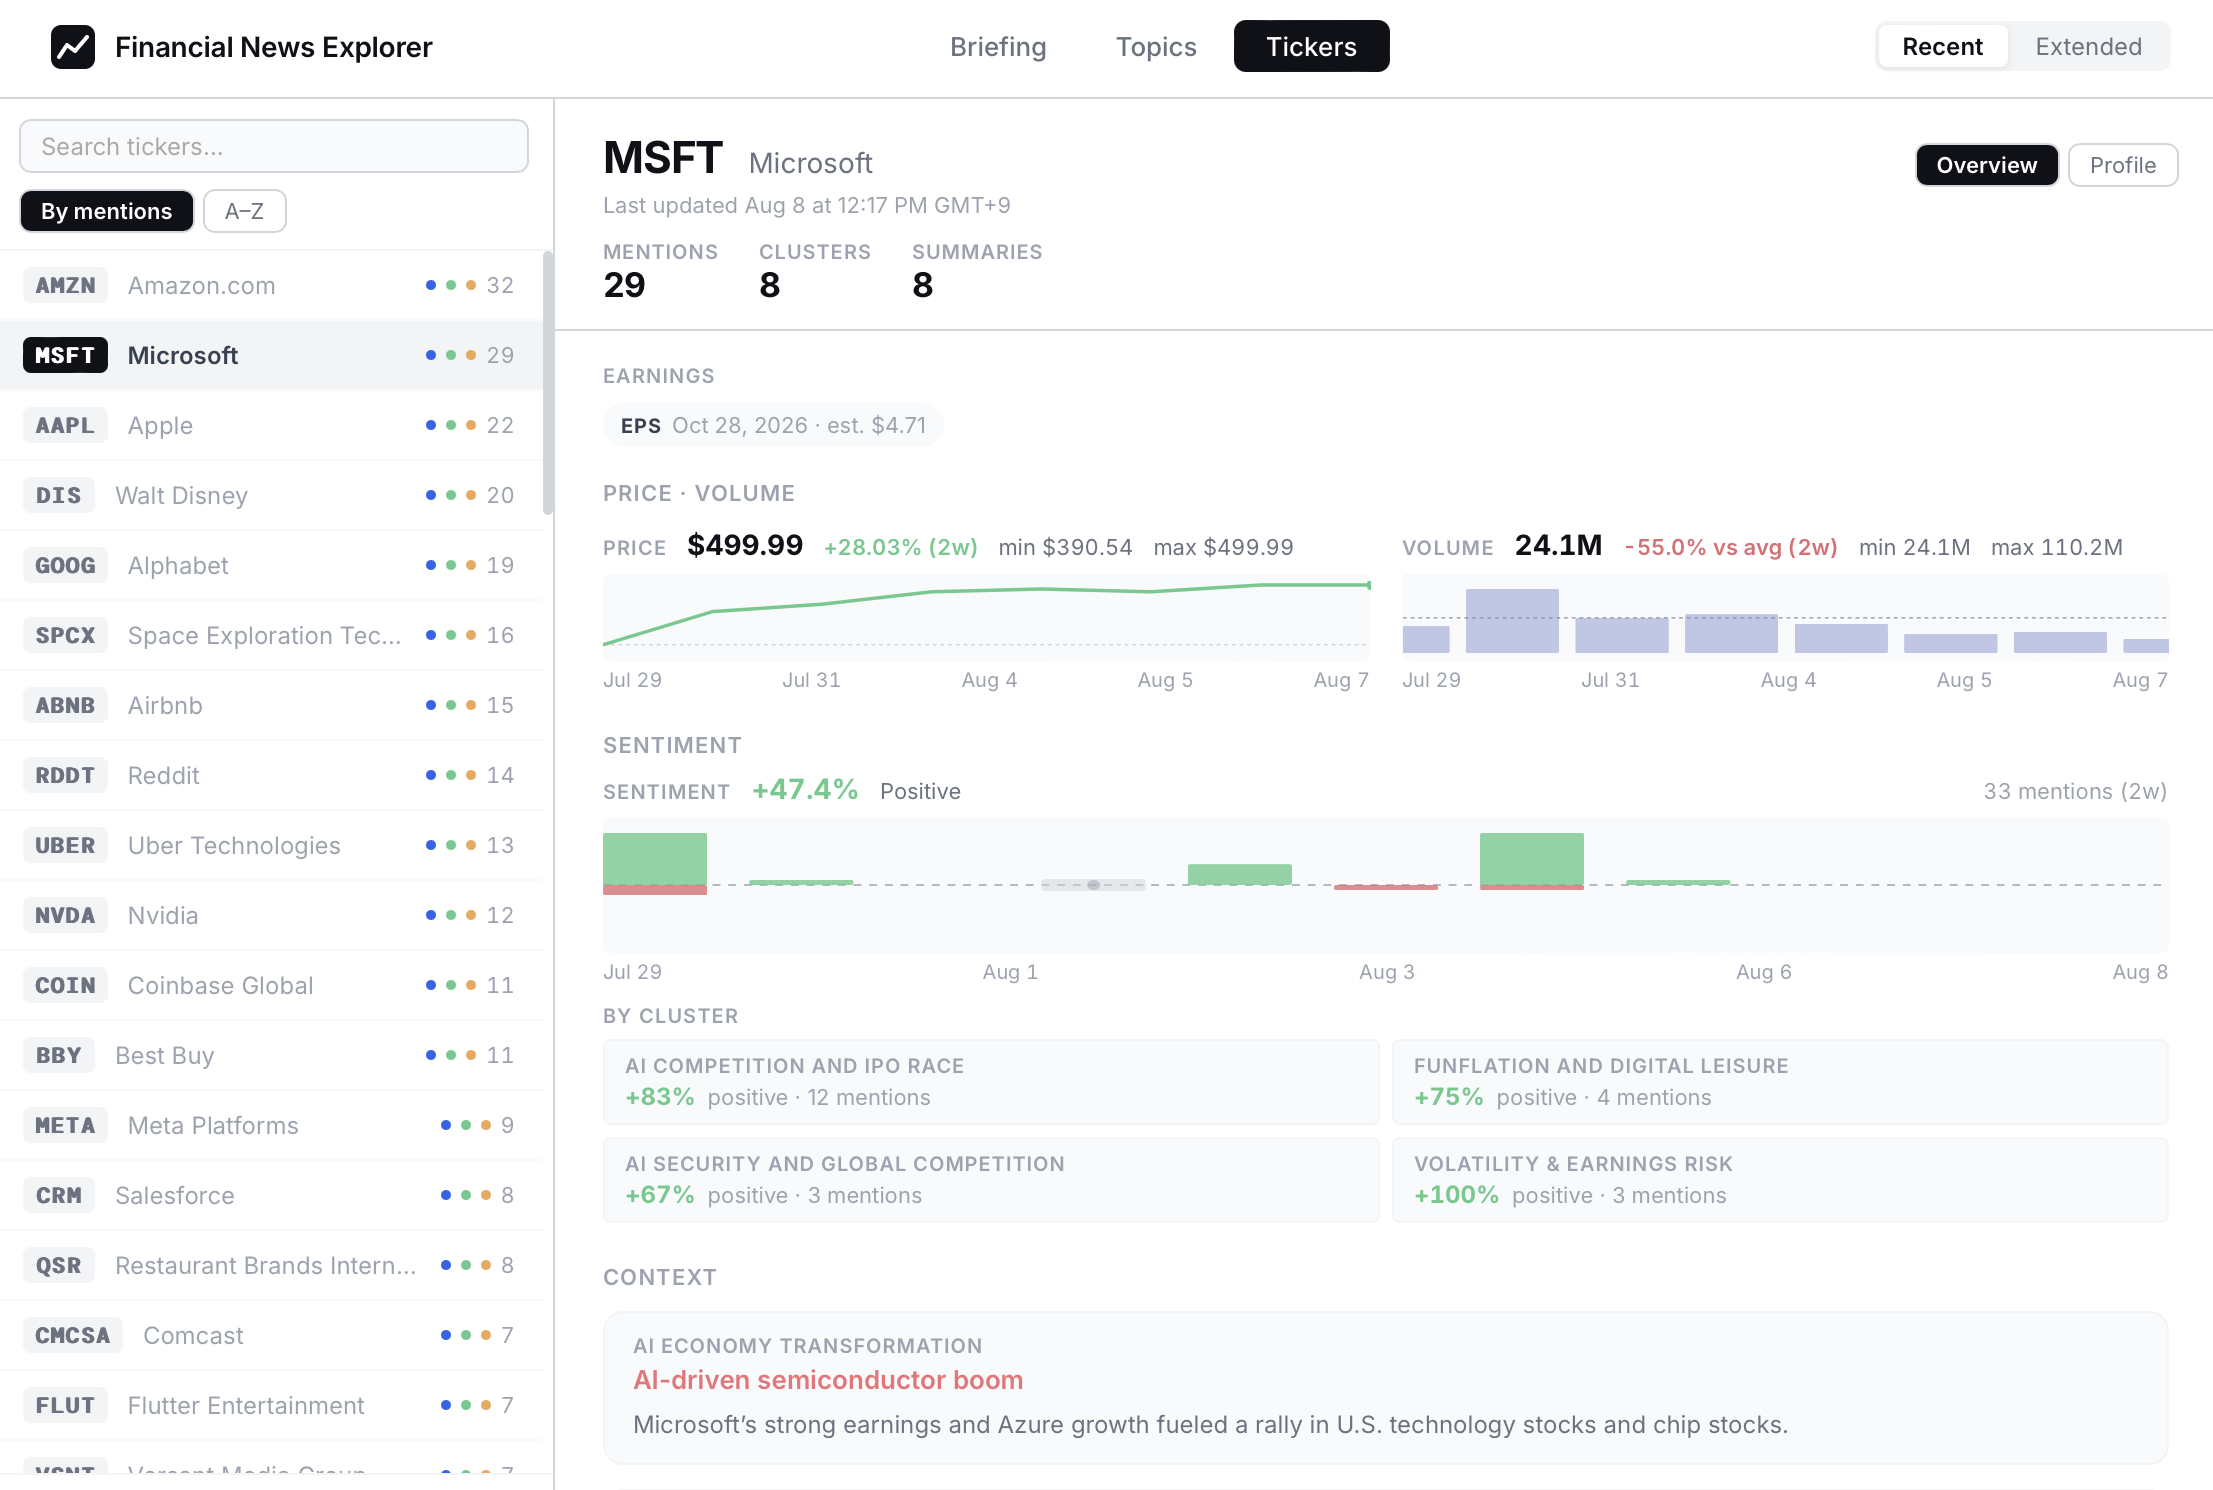
- Overview: Price, Sentiment movements, Topic memberships (each ticker's topic membership summary)
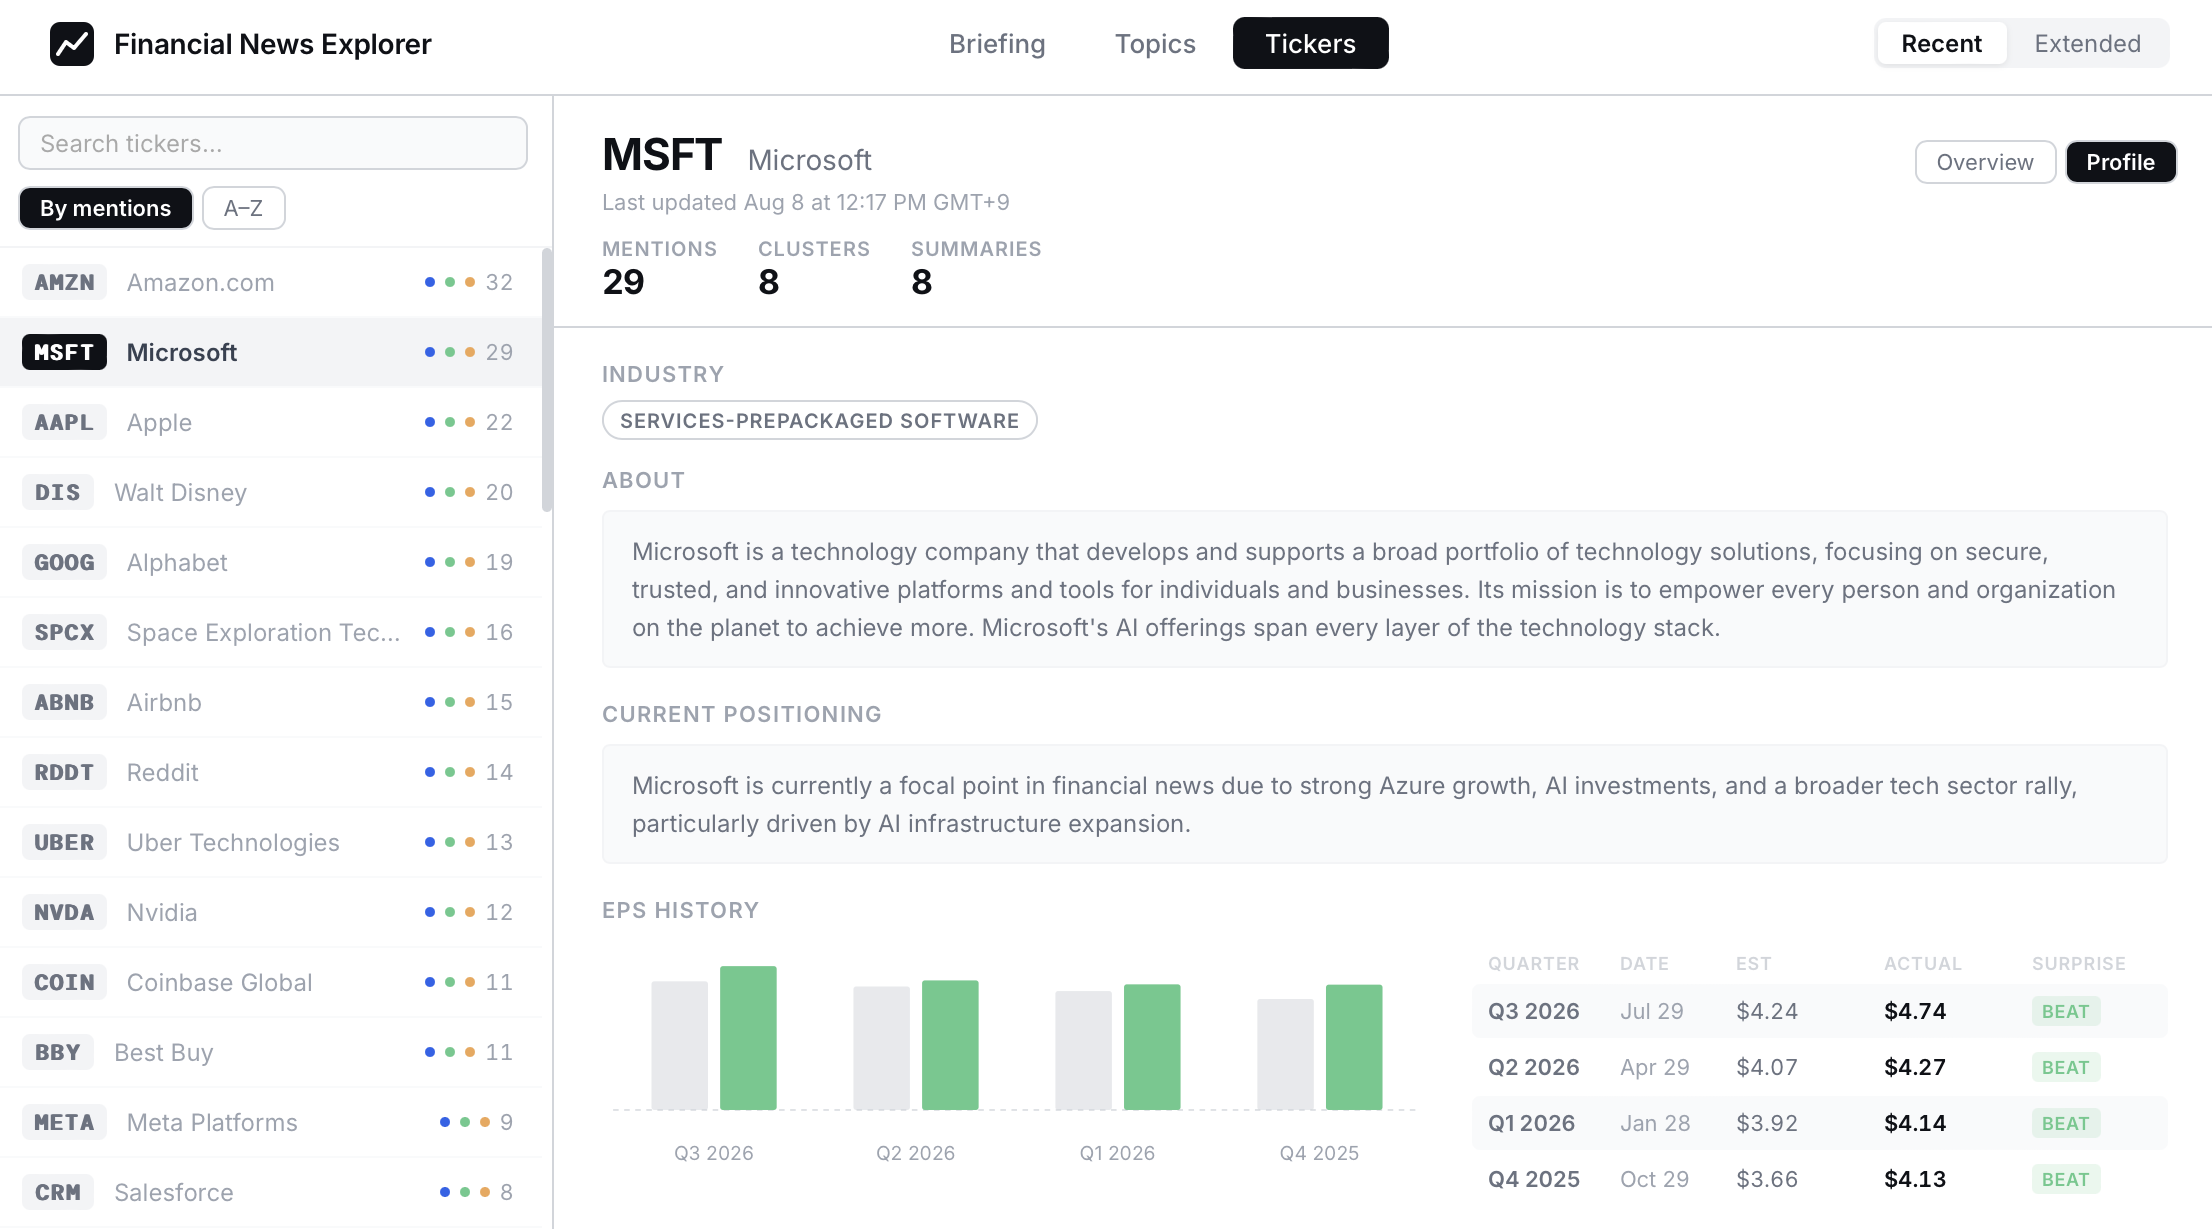
- Profile: Company Profile, Market Positioning, Earning i.e., EPS history, Peer Comparison (via News and Industry)
Examples
Briefings
Economic and Market Snapshots
Market Movers
Topics
Topic Clusters
Tickers
Ticker Overview
Ticker Profile
Ticker Peer Comparison